Recently I had the opportunity to
attend a global analytics conference in Bali (1); interestingly the original conference
venue incorporated a small Hindu temple on the premises. We were ‘lucky’ enough
to be there when they had a ceremony. Unfortunately it was decided to move the
conference; so the original justification was gone, but my topic was unchanged:
the temple was an example of how “data science” has been applied.
The most fun part is that the
people who designed/built the temples didn’t have the internet, didn’t have
Hadoop or multi-thread processors; they might not have even had computers! So
how did they actually do “data science”? By living it, and using it in their
daily lives, incorporating it into the most core aspect of their lives; their
temples; simply put there was no division between religious and non-religious
life.
A Hindu temple isn’t something
you’d visit occasionally, or even weekly, but daily. And this is alive today
too, even though in a much less obvious form. Many people in India (or
Thailand) still stop, pay respects, and say a quick prayer whenever they pass
by a temple.
So what makes a Hindu temple
interesting? It incorporates the belief system.
A very basic unpretentious
primer into Hinduism(2)
One of the fundamental ideas of Hinduism
is the continuous cycle of creation, preservation and destruction (Brahma,
Vishnu, and Shiva) (3). Each universe lasts a Brahma day and a Brahma night,
each being 4.32 billion solar years long (a universe thus lasts 8.64 billion
years), and Brahma lives for 100 years at the end of which he is reborn.
Feeling minuscule yet?
The world of man (and other creatures)
is also cyclical. The aim of man should be to break the cycle of death and
re-birth and join with the Divine, to reach a state peace and harmony.
So it’s cycles within cycles within
cycles...
And how can man break the cycle? This
is where temples come in.
The idea is that temples are a
representation of this idea, to help connect the physical world of man with the
divine world, to reflect the idea of creation, of the cycles and the lay-out of
the cosmos, to make it easier for man to understand.
The architecture of the temples is
designed for that purpose.
That’s where the Vastu Purusha Mandala
comes in. Many of you have heard of Feng Shui; Vastu Purusha is the “Hindu
version” if you will; Vastu refers to the physical environment, Purusha to the
energy and Mandala to the diagrammatic representation.

The centre of the area is Brahma and
the sides are different Gods based on their abilities. In other words, the
centre is source of cosmic energies. The square shape represents life on earth:
it has 4 sides and 4 is an important number in Hinduism: 4 castes, 4 tastes
(sweet, sour, bitter, astringent(4)), 4 cardinal directions, 4 periods or yugas
in each cycle : Satya Yuga (the ‘golden age’ where virtue is everywhere, the
environment and weather pleasant), Treta Yuga (virtue diminishes, agriculture
and mining come to the fore, wars become frequent, and weather starts becoming
extreme), Dwapara Yuga (“after 2”, diseases become rampant) and Kali Yuga (“the final age”, age of
darkness and ignorance and people lack virtue becoming slaves to their
passions, environment is polluted).
What I find interesting in these
descriptions of the yugas is the concern not only for humans, but also for the
environment, and the descriptions of how everything basically degrades over the
4 cycles, until ‘the wheel turns’.
Any guesses which yuga we are in
today?(5)
And to bring it all together, the
lengths of these yugas are: 1.728, 1.296, .864 and .432 million years each,
which adds up to 4.32 million years, a Mahayuga (Big yuga), and there are 1000
of these in a Brahma day.
While the square is fixed and
represents Earth, Heaven or the whole universe is represented by a circle, with
no beginning or end, identical from all sides.
Hence we end up with a basic shape of
a circle contained in a square.
And it is this basic shape that drives
the architecture of Hindu temples, in 3 dimensions.
The basic mandala introduced earlier
is broken down into smaller sections.
The basic square (Sakala Mandala) is
divided into 9x9 (Paramasaayika Mandala),
3x3 (Pitah Mandala), 2x2 (Pechaka Mandala), 4x4 (Mahapitah Mandala) and
8x8 (Manduka Chandita Mandala).
Now I didn’t say Hindus were born data
scientists; things started rather simply.
The above diagram illustrates the plan
of at 5th/6th Century Nachna Parvati Temple (6). The
first thing to notice is how the structures almost purely made of squares with
small satues in niches around it.
The next evolution can about with the Dashavatara
(10 Incarnations) Temple in Deogarh(7)
As it can be clearly seen, the
structure is basically square, but there are some variations on the upper
levels, a slight increase in complexity.
Next is the Suriya (Sun) temple at
Modhara (7):
The plan above (8) shows 3 structures
from top to bottom: Gudhamandapa, the shrine
hall; Sabhamandapa, the assembly hall and Kunda, the reservoir. The shrine hall has alcoves for 8 Deities in 8
directions, is oriented, as a temple dedicated to the Sun God such that the
first sunrays fall on the idol at equinoxes. And the reservoir shows a distinct
patters with multiple small temples (9)
And this peaks in the Kandarya
Mahadev temple (10):
What started as a square, started adding circularity over time
Building something perfectly circular isn’t
that easy, approximating a circular shape is the way forward. What the temple
builders did was to use the golden ratio.
2 measures are said to be in a golden
ratio when the ratio of the longer one (a) to the shorter one (b) equals the
ratio of the sum of their lengths (a+b) to the longer length (a) and is
1.618... The golden ratio is then used to build straight lines that approximate
a circle; the lines following this ratio.
What is the big deal with the golden
ratio? Well it is said that it abounds in nature and it is ingrained in humans
to see this ratio as harmonious. From the golden ration comes the golden spiral
and it can be found in conch shells, in the spiral formation of seeds in a
sunflower, in pine cones, ferns, waves... (11).
And the golden ratio has been used in
designing many familiar logos, including twitter (12), apple, pepsi, BP (new
logo)... (13)
The combination of the concept of heaven and earth with the use of the
golden ration has driven the evolution of temple architecture over time:
But that is not “data science”!
Remember that the hindu temples are built in 3D. Take a second
look at the plan of the 11th Century Kandarya Mahadev temple
(reproduced below)
You will notice that the borders keep
repeating themselves, at a slightly smaller scale. This is how each layer/level
is built on top of the other, allowing the correct positioning of increasingly
more deities in their proper direction, as well as tapering.
Start with a circle and a square, and
we try to create a structure that symbolises that, and in 3D...
This is not that easy to achieve; a
perfectly circular structure would not be able to place the different dieties
in the specific directions they need to be. Hence the circle is broken down by
drawing squares using the golden ratio and creating alcoves for the deities.
Furthermore, to capture all directions, it was necessary to build up, in 3D. The
technique used is one that is used in “data-science”, fractals.
What are fractals? Put simply fractals
are a recurring never ending self repeating pattern. A nice definition is: “A
fractal is a never-ending pattern. Fractals are infinitely complex patterns
that are self-similar across different scales. They are created by repeating a
simple process over and over in an ongoing feedback loop. Driven by recursion,
fractals are images of dynamic systems – the pictures of Chaos. Geometrically,
they exist in between our familiar dimensions. Fractal patterns are extremely
familiar, since nature is full of fractals. For instance: trees, rivers,
coastlines, mountains, clouds, seashells, hurricanes, etc” (14).
Fractals are everywhere and even
children know about them (15)...
Fractals are everywhere and that is
how the ancient Hindus managed to build their temples.
But one other little wonder remains;
it is one thing to build in 3D, but is it just random building, or is there
some religious meaning behind the shape/relative sizes of the different parts
of the temples?
By now, I am sure you know the answer
is that it is not random. Let’s move from Disney Animations back to the
religious meaning embedded in the temples. Remember the temples were designed
to help humans to break free from the cycle of birth and death and join in the
Divine.
The 3rd dimension is
represented by the Shikhara, which is the looming tower in any hindu temple. In
fact the word “shikhara” itself means mountain, and since mountains dominate
the earth and are seen as abodes of the Gods, one can understand the link to
the divine. But that’s not all; these shikharas contain repetitive versions of
themselves that represent the series of repetitive universes, and what better
way to produce this than by fractals?
In fractals are at play in at least 2
ways shown above. First, as shown on the left, each peak is replicated on the
sides,and this is repeated in the smaller towers. Second, as shown on the
right, each smaller peak is a copy in a different scale of the previous one.
This communicates the idea of “whole in part”, ‘Atman’ a ‘soul’ that one must
realise is one’s true self is just the transcendent self; basically once you
realise you are part of the Divine, you reach there.
But there’s at least one more trick in
the temples, again taking the Kandarya Mahadev temple as an example; the ratios
are not random.
In most temples, and Kandarya Mahadev
is an example, the ratios of the largest to the smaller ‘mountains’ are
1:1/2:1/3:1/4. What does that imply?
Let’s look at the distance between the
first and second peaks as the sides of a square (ABCD). From the midpoint of
CD, (M), create an arc that touches the corner A; it touches the corner B which
is the height of the second mountain, and also the vertical at G which is the
height of the third peak.
Now between the second and third
peaks, create another square (GCEF). Replicate it below as (IGHF). Bisect the
latter (N) and create the intersections at I (fourth peak) and L (fifth
peak)...
Now using the first and third peaks,
obtain a square (GDXY). Again bisect the height (Z) and draw an arch from the
top corner (X); it intersects the square at the third peak and the vertical
line at the fifth (L)...
So it’s a recurring pattern,
fractal... Anything else?
Yes, the peaks of alternative
mountains (1st, 3rd, and 5th) obey the golden
ratio: XYGD as compared to UVLG.
Before I bore you to death, there’s
one more aspect I’d like to point out on how the Hindu temple builders used the
temple to make their religion live. The idea of the contemplation of the
divine, understanding the whole in the part and the repetitiveness of the
cycles can be seen by the arrangements of the smaller peaks (16):
The idea is that, as the individual
approaches the temple, 2 things are in evidence. First the sight is drawn to
the line across the peaks of the mandapa (columned assembly halls) and
arthamandapa (entrance porch) in green to the shikhara represents the
ascension, the path to liberation from the cycle. And one can also see the
symmetry, the replication of the towers around the shikhara, and the golden
ratio, in harmony with nature.
And finally, just in case you were
wondering whether the fractals are only on the outside of the temples, they are
also on the inside.
I had initially wanted to show how
this blooming motif is a fractal from a dot within a circle that is repeated,
but I think this piece of art speaks for itself.
I am sure you get the picture; ancient
hindu temple builders were masters at using fractals; but how does this relate
to “data science”? How can I say they were using tools of “data science”?
For those interested in a pictorial
journey through this temple, please refer below (17)
Fractals and “data science”
The most common and obvious use of a
fractal is to identify a pattern and look for the same pattern elsewhere,
possibly at a different scale. But even before we go to actual use cases,
fractals are also very useful in the dreaded and often ignored area of data
preparation.
Putting your money where your mouth is
So first of all, to show the
usefulness of fractals in today’s world, I thought it would be nice to look at
money making.
The idea is that stock markets follow
patterns, and using fractals to identify long term trends can be hugely
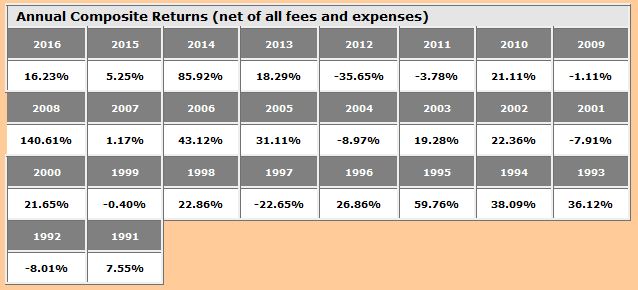
profitable. This is shown by the results of the Dreiss Research Corporation (18)
There have been bad years and good
year, but since inception, the average rate of return of this fund is a
compounded Rate or Return of 15.06% and a worse monthly performance of -22.81%.
So how does he do it?
“Trading Methodology: Dreiss Research
Corporation's Global Diversified Program is based on the mathematical concepts
of fractal geometry, which support the theory that market prices exhibit
persistent behavior. Founder and President Bill Dreiss
has developed two proprietary methodologies based on these concepts, the
Fractal Wave Algorithm, which is used to identify trends and key turning
points, and the Choppiness Index, which is used to determine the degree of trendiness or choppiness in market prices. The system
is highly diversified and very long-term in nature. Due to the long-term
time horizon, the program can at times experience a relatively high degree of
volatility.”
The basic idea is based on the idea
that, contrary to the efficient market hypothesis whereby market movements are
random, there is a tendency for markets to persist in the same direction over a
certain number of time frames. The idea was floated by many including
Mandelbrot the ‘father’ of modern fractal theory in 1966 (19) and again more
pointedly in 2001 (20) Hence it is possible for a disciplined trader to take
advantage of these trends by following them and generating profit.
The idea of using fractals seems
straight forward. Fractals are self-similar across scale. Hence the originators
of the Fractal Wave Algorithm implemented the idea of nested patterns to
identify trends and turning points, support and resistance.
The system is applied to weekly charts
and focuses on single or multiyear cycles and is purely technical or automatic
trading.
Another application of fractals is in
the Choppiness Index to distinguish orderly (trending markets) from
consolidating (Choppy) markets which influence exit signals.
The proof of the pudding is in the
eating, 15.06% per annum returns yearly is more than decent performance.
Hence, I can say that analysing and
using fractals has been proven in the 20th and 21st
Century to indicate market behaviour and allow analysts to generate decent
profits.
I leave the final word on the topic to Mr Dreiss himself: ““I have
an affinity for making things as simple as possible. These elaborate systems
with huge amounts of computer power and rooms full of PhDs is not something I
am interested in. If you look at [my] performance, it is certainly comparable
to other people who do things that are a lot more complicated, so I am not sure
what that buys you.” “Some people want that lifestyle where they work 80 hours
a week and are constantly in the trenches. That is not anything that I was
interested in.”” Now that is something many of us can relate to:
Surviving in the first place
Another application of fractals is in
a field that should be dear to the hearts of the participants in the Bali
Conference, was Mt Agung about to go boom...
Fractals have been proven to be useful
in understanding the process of degassing, that is releasing large amounts of
gas between eruptions. By monitoring this degassing, once can understand what
the volcano is up to, what is happening in the conduits and reservoirs of the
volcano. In 2014, Girona and al published a paper (21) which showed that the
frequency spectra of H2O emissions follow a well defined fractal distribution
(at least for Erebus and Mayon) and hence, a method has been developed to do
real time monitoring at active volcanoes.
Basically, fractals help understand
what is happening inside volcanoes simply by studying the plumes emitted by the
volcanoes, specifically the light scattered by water droplets in the gas
emitted, safely, from a distance.
Another approach is to look at
volcanoes as a system, and understand the behaviour of this system as a whole.
In 2014, Gusev published a paper which showed the fractal nature of the
sequence of volcanic eruptions worldwide (22). Basically what the author showed
is that obviously, volcanic eruptions do not occur uniformly over time, but
rather in clusters. The eruption rate tends to be episodic and spiky, and each
cluster tends to be fractal/self-similar in nature. Hence the idea is that
there is a global mechanism that is responsible for this and could therefore
help us predict ‘episodic discharge of material’.
To conclude I would say that:
1. Ancient
Hindu temple architects/builders made use of fractals to build the temples and
build in the concepts of Hindusim to enable devotees who go to the temples to
have a better chance of freeing themselves from the cycle of death and rebirth.
2. Fractals
have been used everywhere in temples, and the mastery of fractals without the
help of computers is remarkable.
3. Fractals
have had a renaissance, and Mandelbrot has been associated with that
4. The first
use case of analytics of fractals is about the use of fractals in trading strategies.
This method as devised by Dreiss has proven itself yielding around 15% returns
cumulatively per annum since inception in the early 90s.
5. The second
use case of fractals mentioned is in the area of seismology and volcanology. It
is possible to use fractals to analyse volcanoes degassing and understand the
mechanisms happening inside the volcano. This presumably can help predict local
eruptions
6. Another
approach is to look at worldwide eruptions and understand that these tend to
cluster and follow fractal patterns. Hence it is possible to understand the
underlying causes and better predict eruptions on a global scale.

Notes and Further Readings
- https://www.meetup.com/Singapore-Analytics-Freelancers/photos/28398937/
- I have extremely limited
knowledge of the topic but have researched only in so far as was needed for
this topic.
- I always thought that whether you
believe that things are cyclical or linear makes a big difference to your
outlook on life, whether things are interrelated or not. One simple
manifestation of this is the eastern ‘holistic’ medicine and the western
‘symptomatic’ medicine.
- Now you know why Thai food for
example (5 tastes) has more layers of flavour than Indian food ;) that’s a
discussion for another blog
- For those who guessed Kali Yuga,
congrats, as for the rest, stop being so pessimistic. J
- By A. Cunningham (1885) -
https://archive.org/stream/reports14indigoog#page/n248/mode/2up, Public Domain,https://commons.wikimedia.org/w/index.php?curid=64394729
- http://www.spiceflair.com/early-hindu-temples-deogarh/
- By A K Forbes - Alexander Kinloch
Forbes (1856) Râs Mâlâ: Or, Hindoo Annals of the Province of Goozerat, in
Western India, 1, Richardson Bros., pp. 255–256, Public Domain, https://commons.wikimedia.org/w/index.php?curid=38926919
- https://www.wlivenews.com/modhera-sun-temple-and-step-well-surya-kund-at-gujarat-india.html
- http://shodhganga.inflibnet.ac.in/bitstream/10603/38879/16/16_chapter%207.pdf
- https://www.mnn.com/earth-matters/wilderness-resources/blogs/how-golden-ratio-manifests-nature
- https://www.flickr.com/photos/twitteroffice/5034817688/
- https://tomscctwebblog.wordpress.com/2014/03/04/the-golden-ratio-and-logo-design/
- http://fractalfoundation.org/resources/what-are-fractals/
- https://en.wikipedia.org/wiki/Frozen_(2013_film)
- Fractal geometry as the
synsthesis of Hindu cosmology on the Kandariya Mahadev temple Khajuraho (Md
Rian, Jin-Ho Park, Dongkuk Chang)
- http://www.indiamike.com/india/bus-and-train-photologues-f167/photologue-of-short-trip-to-heart-of-incredible-india-khajuraho-panna-and-orchha-t193167/
- http://dreissresearch.com/performance_update.html
- Mandelbrot – Is there persistence
in stock price movements
- Mandelbrot – Scaling in financial
prices: II Cartoon Brownian motions in multifractal time
- Girona and al (from Singapore and
Philippines)- Fractal degassing from Erebus and Mayon Volcanoes revealed by a
new method to monitor H2O emission cycles
- Gusev – The fractal structure of
the sequence of volcanic eruptions worldwide: Order clustering of events and
episodic discharge of material